
Your MicroSaaS Onboarding Should Deliver One Small Win
A new customer did not sign up to explore your dashboard. They signed up to finish a job. Your first-run experience should help them finish the smallest useful version of that job.
Amplitude's activation framework connects onboarding with discovering value and the first value exchange. The practical design question is: what could a new user accomplish before they need a tour?
Our illustrative product turns an accepted design proposal into a project checklist. Its first win is an editable checklist the designer can use on a real project. A completed profile is useful to the company; it is not necessarily useful to the customer.
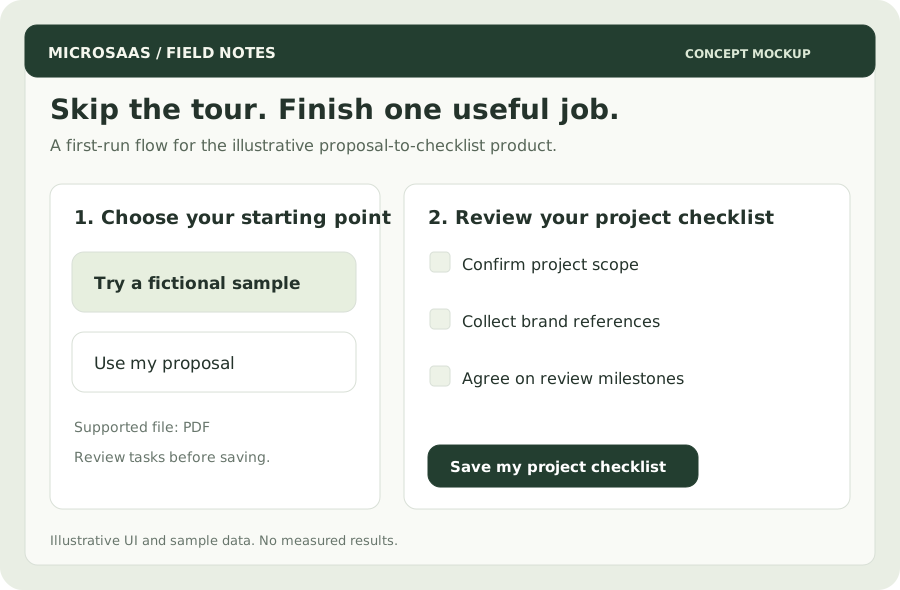
Concept mockup: a sample lets visitors inspect the outcome before uploading their own document. Sample success and real-project success are measured separately.
Define an outcome you can observe
Write a one-sentence definition:
A new user reaches first value when they create, review, and save a checklist for their own client project.
This is more specific than “uses the app.” It also prevents a sample-data click from inflating your activation metric.
| Product | Small useful outcome | Misleading substitute |
|---|---|---|
| Invoice reminder tool | First reminder scheduled for a real unpaid invoice | Email account connected |
| Article summarizer | Summary saved or exported for an article the user chose | Sample summary viewed |
| Appointment tool | A usable booking link created and shared | Profile completed |
| Proposal checklist tool | Own-project checklist reviewed and saved | Checklist generated but never opened |
Treat the definition as a hypothesis. Later, compare users who reach it with users who return or renew. Correlation can help you choose what to investigate; it does not prove that forcing the action will cause retention.
Build a three-step first run
Step 1: Show what the output looks like
Offer “Try a sample” beside “Use my proposal.” A fictional sample removes the need to find a document just to understand the product. Mark it clearly and let users edit the output.
Suggested copy:
Turn an accepted proposal into a ready-to-edit project checklist. Try the example, or upload your own PDF.
Say which formats are accepted and what happens to uploaded data. Ask for only the information needed for this result. Company size, job title, and profile photo can usually wait.
Step 2: Make the output usable
Show the generated tasks immediately. Let users rename a task, remove a bad suggestion, and save the checklist. Make it clear that generated output needs review; do not present uncertain suggestions as facts.
If generation fails, keep their input available and offer a useful correction or retry. A blank dashboard after signup is a dead end.
Step 3: Ask for the next commitment
Once the user has seen a useful result, offer the relevant next step: export, use on another project, invite a collaborator, or choose a plan. Ask for integrations only when they help that next action.
A pricing step is easier to understand when the user knows what they are buying. This does not require giving away unlimited work: a bounded sample or a clearly described trial can demonstrate value.
Instrument a small, meaningful funnel
Track these events with account ID, timestamp, acquisition source, and whether the input is sample or real. Do not send raw proposals to analytics.
signup_completed
checklist_started       { input_type: sample | own }
checklist_generated     { input_type, duration_ms }
checklist_saved         { input_type, task_count }
checklist_exported      { input_type }
Define seven-day activation rate as new accounts that save an own-project checklist within seven days, divided by new accounts whose seven-day observation window has finished. Excluding immature cohorts avoids treating yesterday's signup as a failure too early.
For an illustrative cohort of 40 eligible signups, 24 start an own-project checklist, 18 receive output, and 12 save it:
- Signup-to-activation: 12 / 40 = 30%.
- Started-to-generated: 18 / 24 = 75%.
- Generated-to-saved: 12 / 18 = 66.7%.
These are example calculations, not industry targets. They suggest observing failures during generation and asking why some users do not save the result.
Measure time without hiding abandonment
Calculate time-to-first-value from signup to the first own-project save. Report the median and a slower percentile among activated users, alongside the activation rate. A fast median alone can look excellent while most users never succeed.
For a weekly tool, also check whether users return the next week. A daily retention measure may be inappropriate for a workflow that naturally occurs once per project.
Improve one bottleneck at a time
Watch five new users attempt the job without coaching. Record where they pause, what they expect, and which words confuse them. Then choose one change: a sample, clearer input requirements, a shorter wait, or a better output editor.
With low traffic, interviews and session observations may be more informative than a small A/B test. Keep a dated change log and compare cohorts cautiously.
The goal is a customer who can say, “I have something useful now.” Build that path before adding an onboarding checklist full of tasks that mainly serve your own reporting.


